Block«Клинические рекомендации»
A web page has appeared in MedLock «Главная»where you can quickly track the performance of your clinic.
The section is available only to the head of the clinic, and other employees can access it through the Medlock Admin profile (sys_).
For more information, see the article Creating access for a new administrator.
The row with the right to view the section is called «Главная страница». Check the box next «Главной страницы»to it.
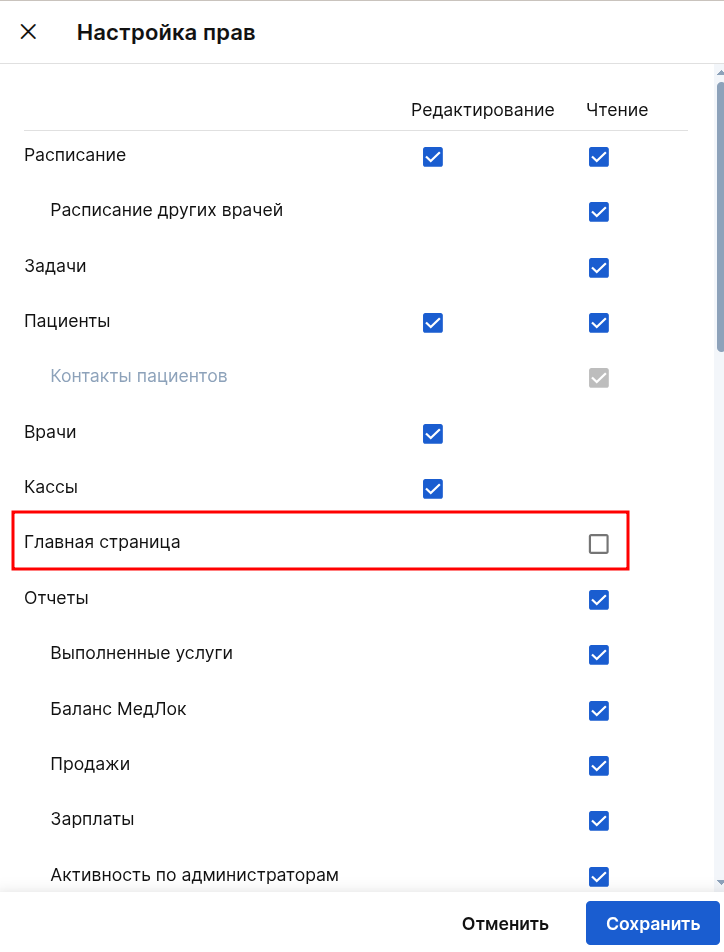
To easily navigate from the block on the main page to the detailed report it is associated with, configure access «Отчёты»to the following reports in the sub-item in the same window.:
- Sales
- Salaries
- Treatment plans
- Activity by doctors
- Activity by cabinet
- Average receipt
- Telephony
- Make an appointment
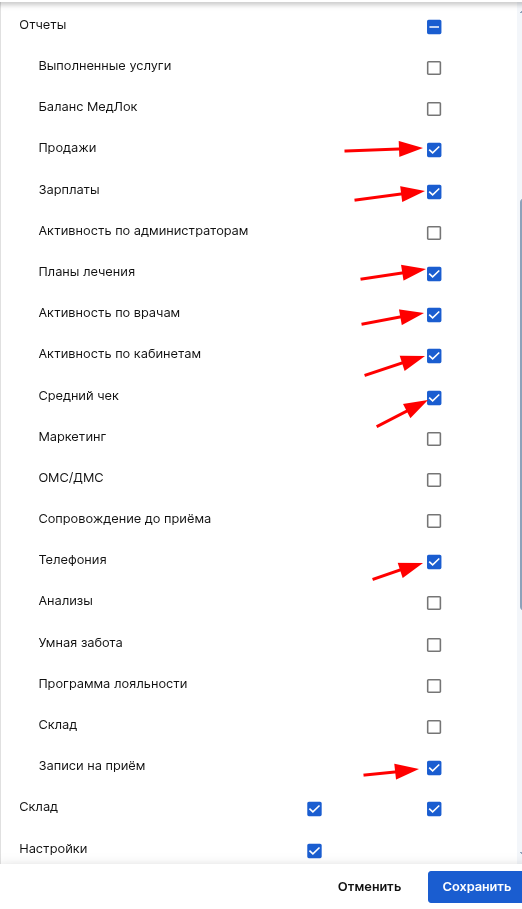
After setting up all access rights, click below«Сохранить».
After that, the employee you gave access to will always have a lock on «Главной странице».
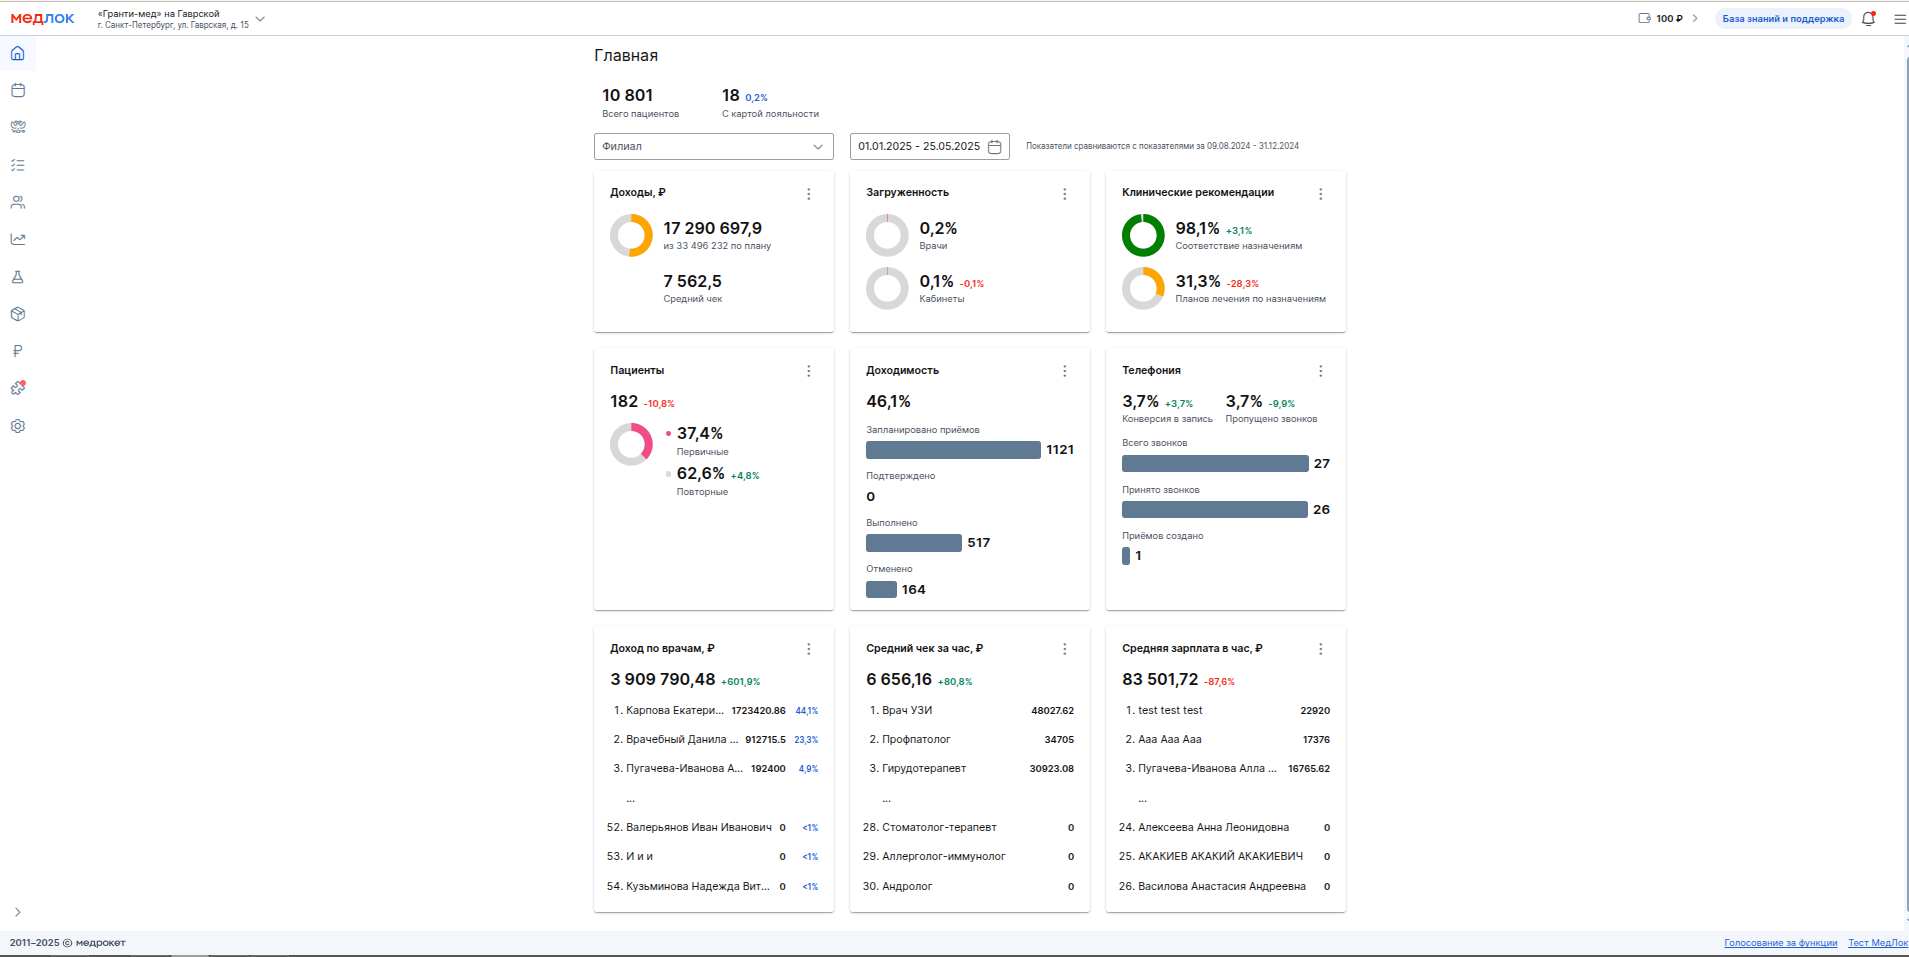
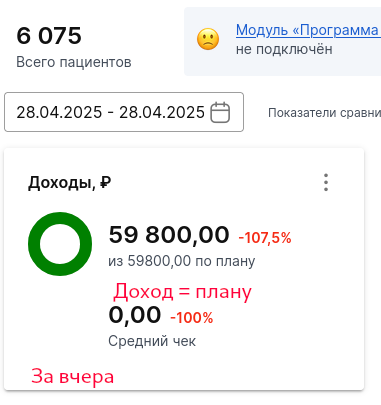
The total number of patients in the clinic's database is indicated at the top of the page. On the right is the number of patients with a loyalty card and their percentage of the total number (if the module «Программа лояльности»is enabled).
Filters are available below to get more detailed information. Filtering by clinic branches and by opening hours is available. Filtering does not affect the display of the number of patients and the number of patients with a higher loyalty card.
Filter operation«Филиалы» 
By default, the filter «Филиалы»is empty and information is displayed everywhere for all branches of the clinic.
To view the data for a specific branch, select it in the filter.
To view the information for all branches again, reset the filter value using the X.
Filter operation«Период»
By default«Период», the current day is always shown in the filter.
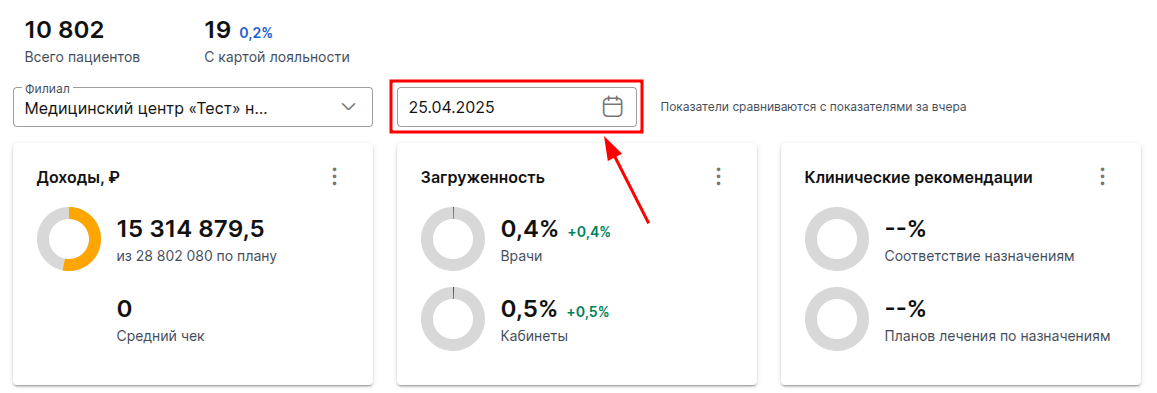
To select a different period, click on the filter and select the desired value.
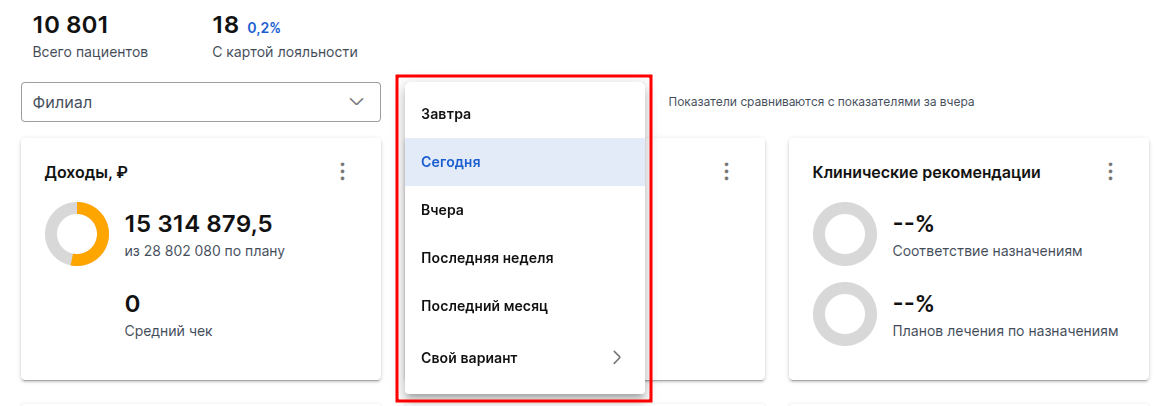
Available for selection:
- tomorrow: you will see the indicators of the next day, as well as the difference with the indicators for the current day.
- Today: the figures for the current day, as well as the difference with the figures for yesterday.
- yesterday: the figures for yesterday, as well as the difference with the figures for the day before yesterday.
- last week: figures for the previous 7 calendar days from today and the difference from the same period a week earlier.
- Last month: figures for the 31 previous calendar days from today and the difference from the same period 31 days earlier.
- your own option: specify your period that you want to analyze.
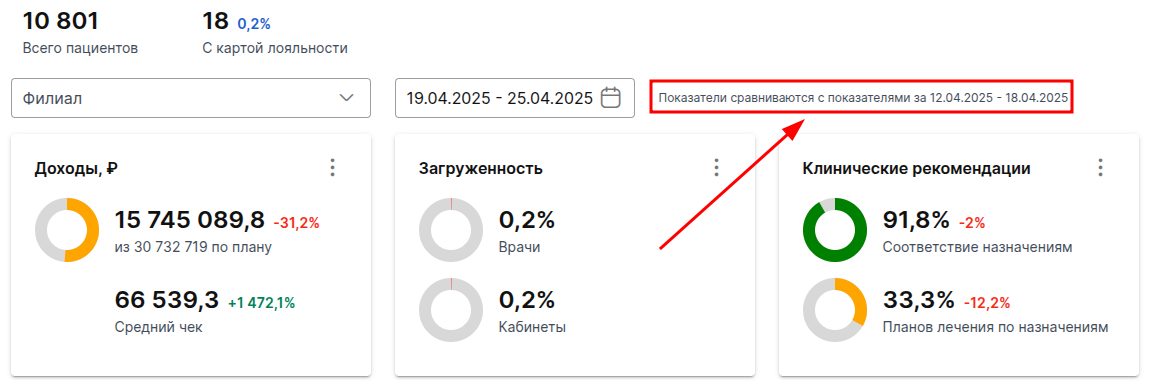
To the right of the filter, the comparison period in the reports will always be shown.
Report blocks
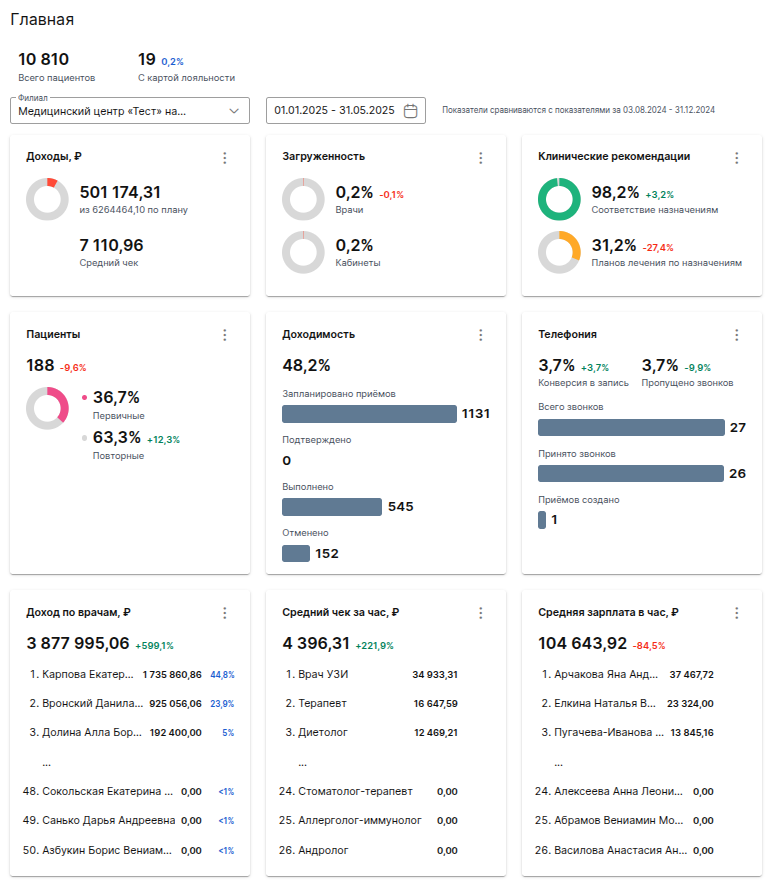
Nine blocks are available:
- Income.
- Workload.
- Clinical recommendations.
- Patients.
- Profitability.
- Telephony.
- Income for doctors.
- The average receipt per hour.
- The average salary per hour.
The data in the blocks is updated every 15 minutes.
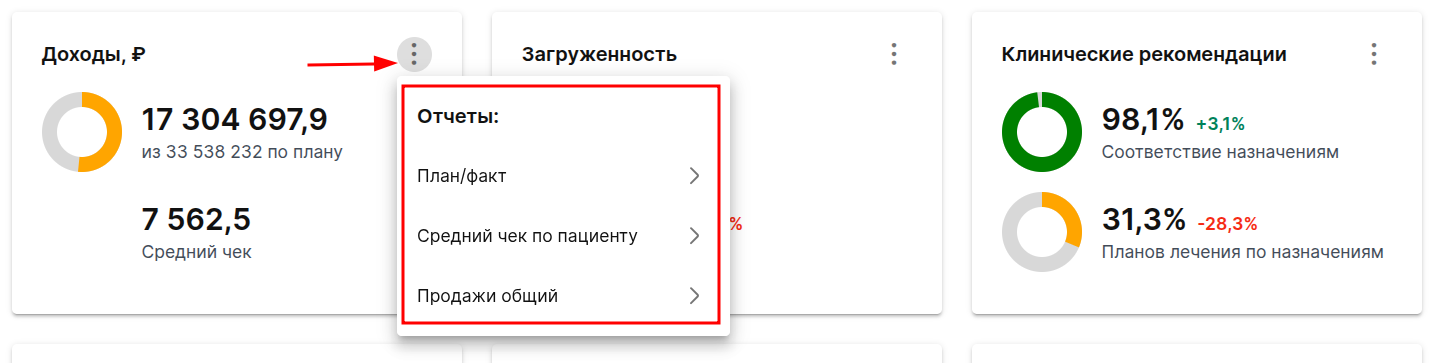
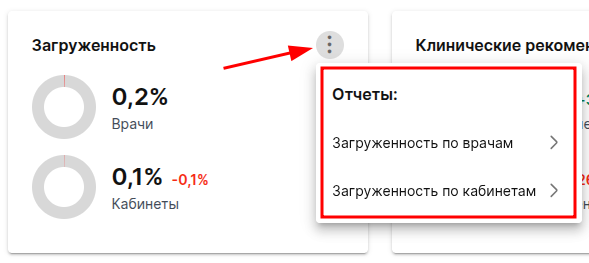
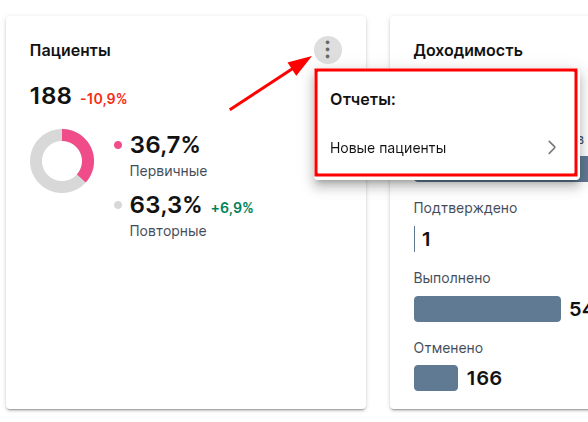
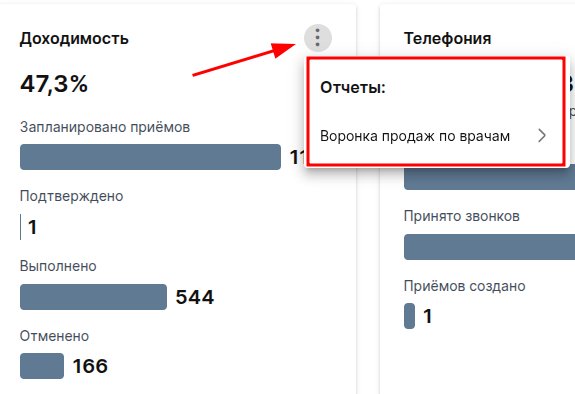
Each of the blocks has a button with three dots in the upper right corner. By clicking on it, you will see a list with the names of the reports from which information is received in this block.
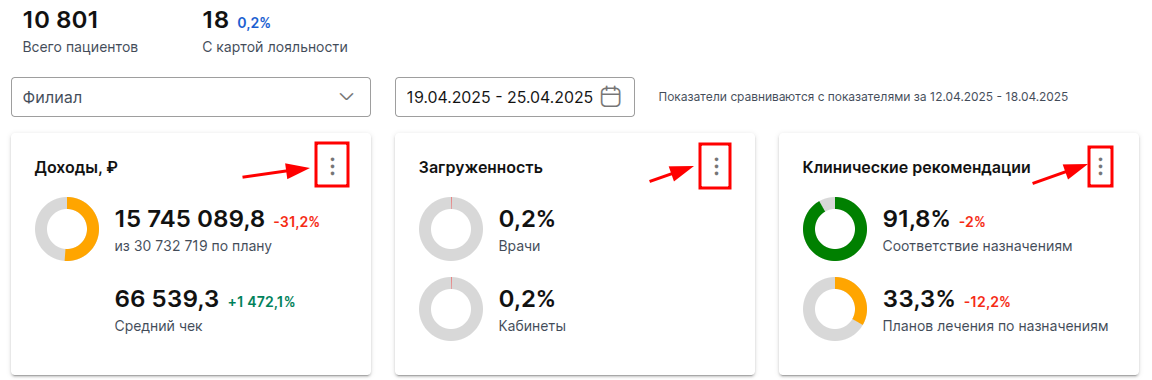
Click on the name of the report and you will be redirected to it in the corresponding section of the MedLock.
All report blocks have percentage numbers that help you see an increase or decrease in the indicator compared to the previous period in the past.
In all report blocks, except «Телефонии»for them, they are colored according to the same principle — red if negative and green if positive.
The principle of coloring percentages in the block of reports «Телефония»is described below in this article.
Income
The data in this block is based on the following reports:
- Plan/fact.
- The average receipt for the patient.
- Sales are general.
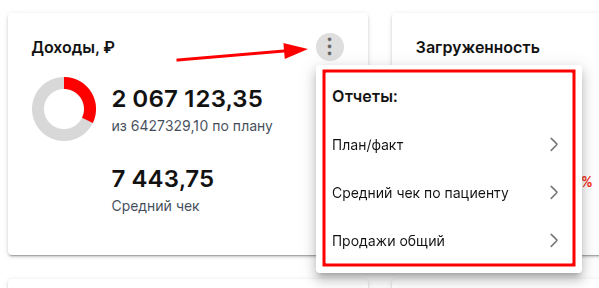
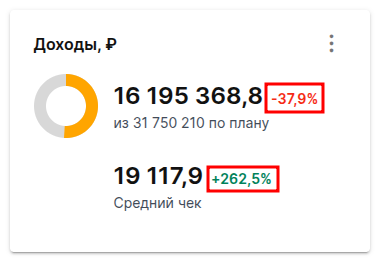
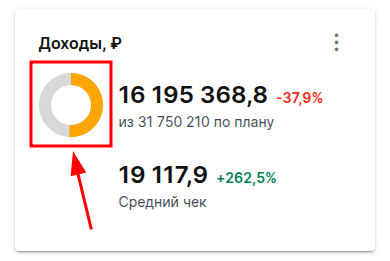
The block «Доходы»shows the total income and the average check of the clinic or individual branch for the selected period.
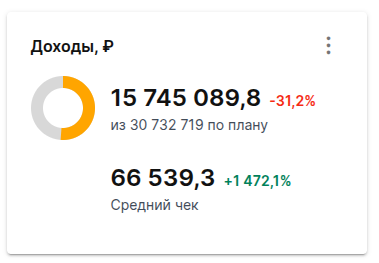
Important! The percentage number to the right of the main indicator is always compared with the same period in the past (one percentage is subtracted from the other). Therefore, there may be a situation when you see that the plan for the selected period is 100% fulfilled, the amount of income is more than in the same period in the past, but the percentage is negative.
An example of a similar situation:
The day before yesterday, revenue exceeded the plan by 107%.

The next day, the income was exactly as planned and the increase was 0%, so a negative percentage is displayed.
The color and occupancy of the pie chart will change depending on how well the clinic's income plan has been completed over the selected period.:
- 0% — 50%: Red.
- 51% — 75%: Yellow.
- 76% — 100%: Green.
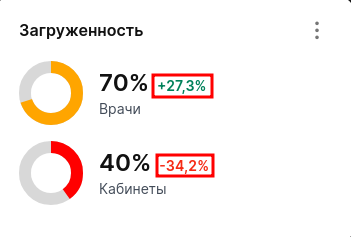
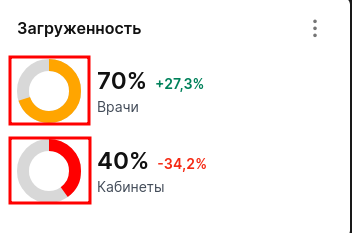
Workload
This block shows the data from the reports:
- Workload for doctors.
- Office workload.
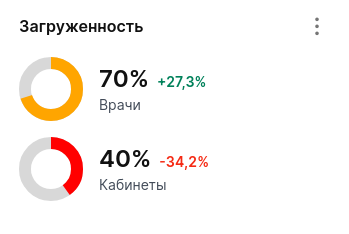
The color and occupancy of pie charts change as follows:
The diagram «Врачи»:
- 0% — 50%: Red.
- 51% — 75%: Yellow.
- 76% — 95%: Green.
- 96% — 100%: Red.
The diagram «Кабинеты»:
- 0% — 50%: Red.
- 51% — 60%: Yellow.
- 61% — 75%: Green.
- 76% — 100%: Red.
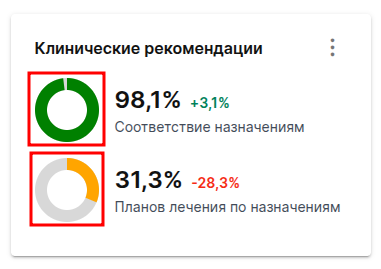
Clinical recommendations
Important! This block will only be available when the module is connected«Клинические рекомендации».
The indicators in this block are based on the following reports:
- Summary of the types of treatment plans.
- Matching the assignment to the label.
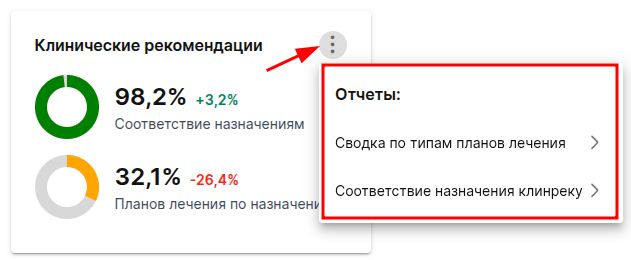
This block of reports shows statistics on the use of clinical recommendations.
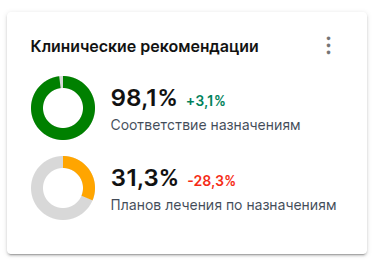
The upper diagram shows the compliance of doctors' prescriptions with clinical recommendations.
The bottom chart shows the percentage of treatment plans based on clinical recommendations out of the total number of treatment plans.
The color and occupancy of the upper pie chart «Соответствие назначениям»will change as follows:
- 0% — 30%: Red.
- 31% — 60%: Yellow.
- 61% — 100%: Green.
The color and occupancy of the lower pie chart «Планов лечения по назначениям»will change like this:
- 0% — 20%: Red.
- 21% — 50%: Yellow.
- 51% — 100%: Green.
Patients
The metrics in this block are based on the report«Новые пациенты».
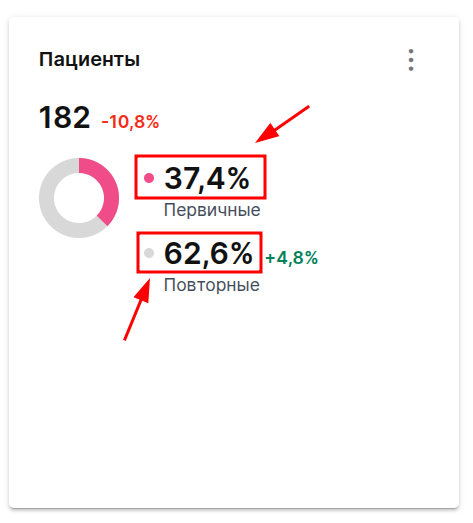
This block shows the total number of enrolled patients for the period selected in the filters, and the number of primary and repeat patients.
The MedLock has a setting for the patient's primary care period, depending on which data may vary. By default, the patient's primary care period is 3 months. For more information, see the article in our Knowledge Base.
If the primary period is changed, the previous data will not be recalculated.
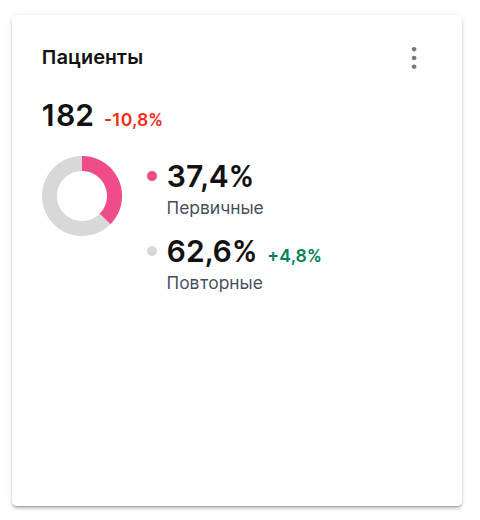
The color and occupancy of the pie chart are distributed as follows:
- The pink part of the circle is the number of primary patients.
- The gray part of the circle is the number of repeat patients.
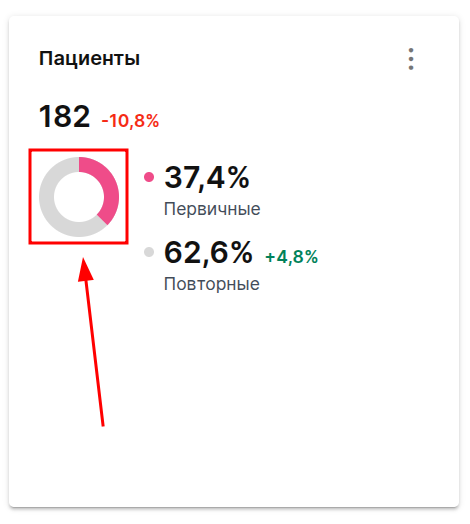
To the right of the chart are the percentages of primary and repeat patients.
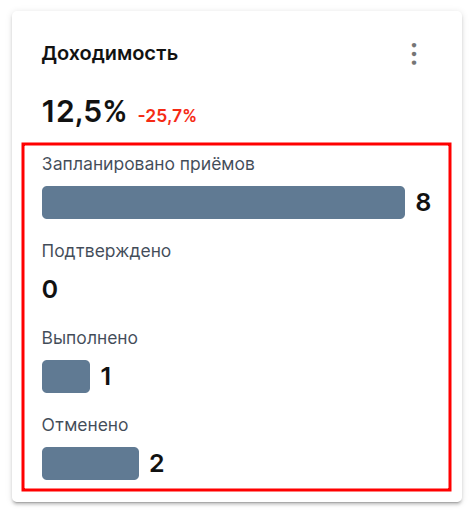
Revenue
The data in this block is based on the report«Воронка продаж по врачам».
The ratio of the total number of records and the number of completed receptions is displayed at the top of the block.
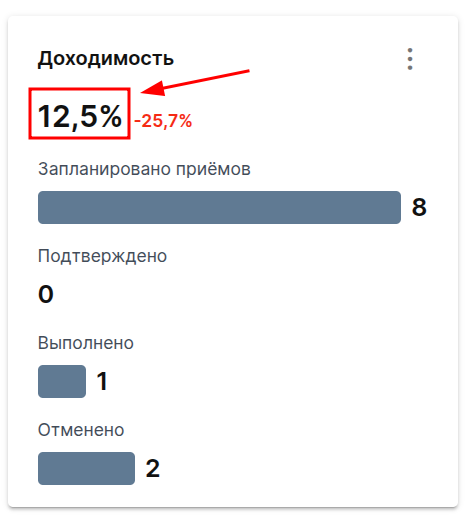
The number of receptions in four different statuses is shown below.:
- Scheduled receptions.
- Confirmed.
- Done.
- Cancelled.
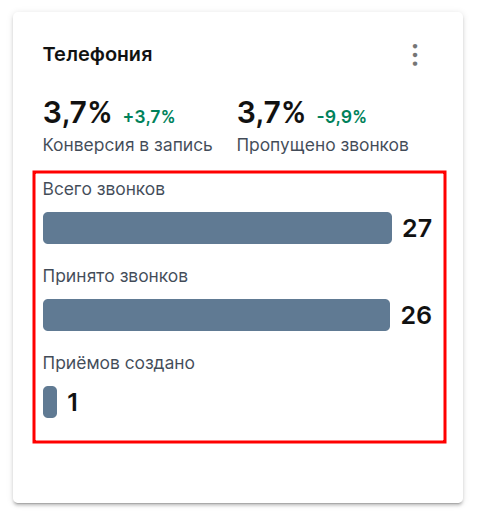
Telephony
Important! This block will only be available when the module is connected«Телефония».
The indicators in the block are based on the report«Эффективность телефонии клиники».
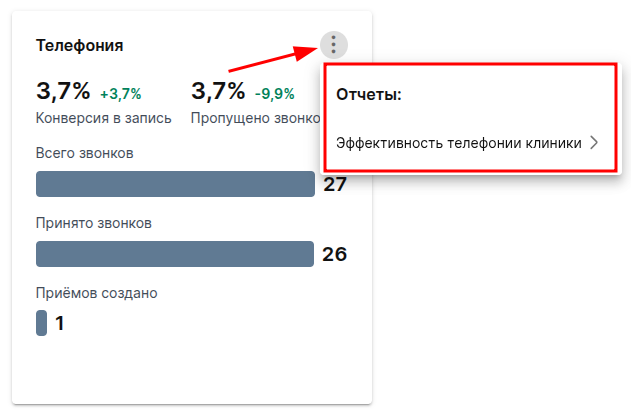
The report allows you to see the results of telephony in your clinic.
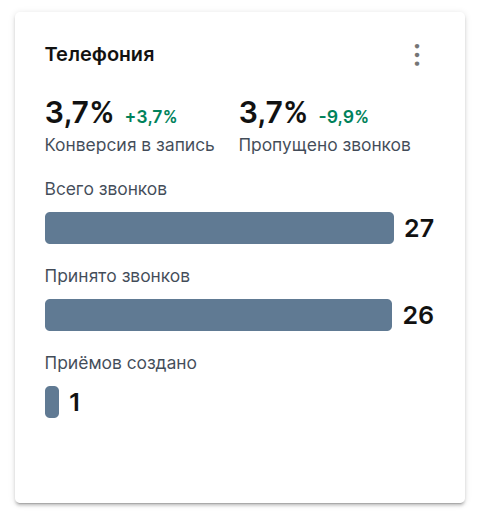
The first two numbers at the top of the block show the percentage of conversion to recording and the percentage of missed calls during the selected period.
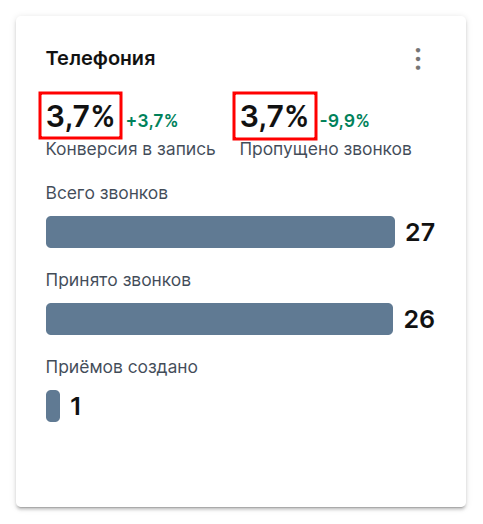
The numbers on the right show the difference between these indicators and the same period in the past.
For record conversion, a positive percentage will be green, and a negative percentage will be red.
For missed calls, the positive percentage will be red, and the negative percentage will be green.
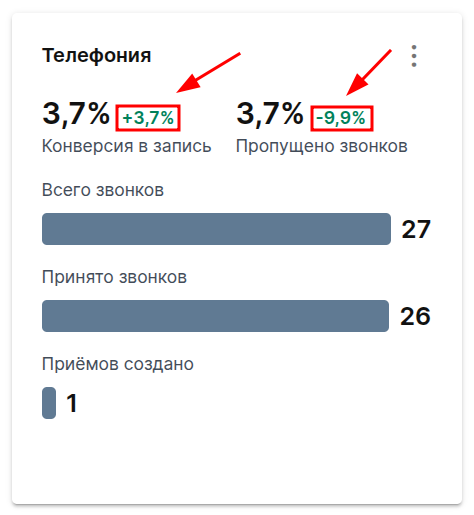
Below are the graphs and the number of:
- Calls received at the clinic («Всего звонков»).
- Calls that the clinic has answered («Принято звонков»).
- The receptions that were created as a result of the call («Приёмов создано»).
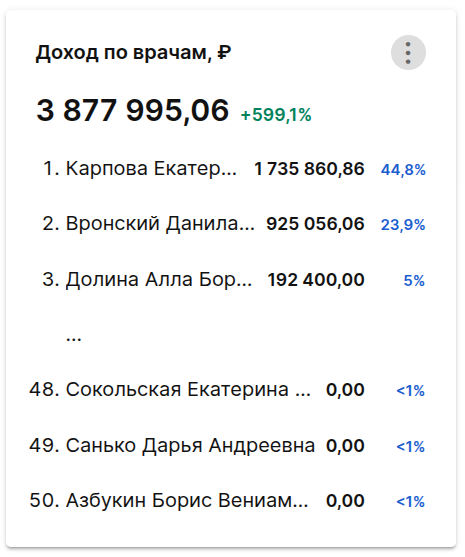
Income by doctors
The data in the block is based on the report «По врачам»in the report group«Выполненные услуги».
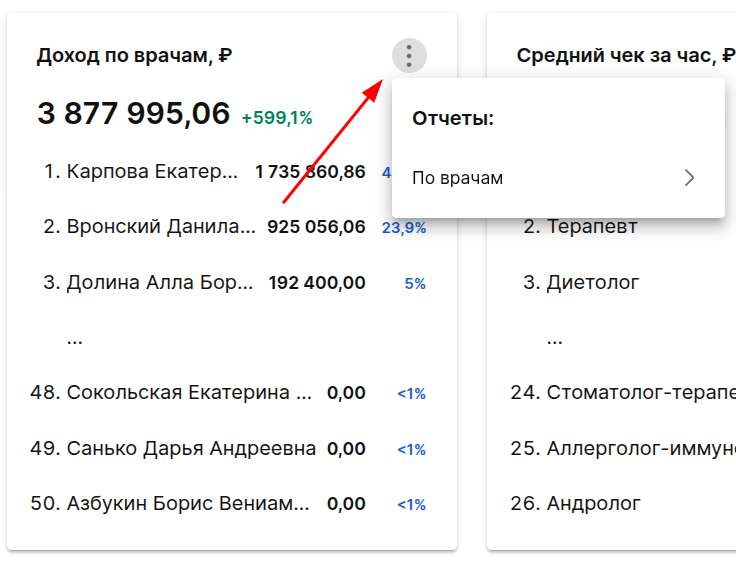
This block shows the total cost of the services provided by doctors for the selected period.
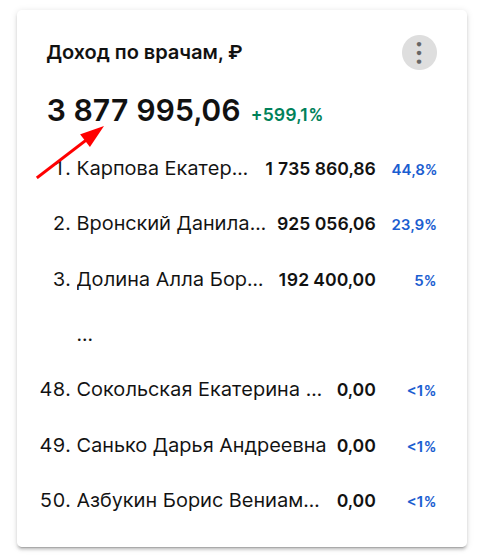
Each row displays:
- Full name of the doctor.
- The amount of income for the selected period.
- The percentage of this amount from the total income of the clinic.
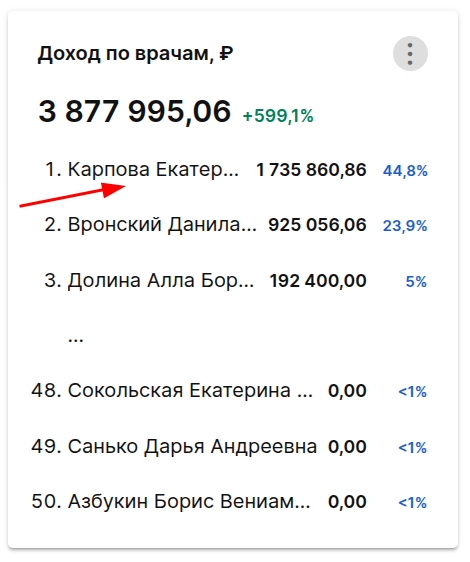
The list shows the first three doctors and the last three in terms of income. To view all the doctors, go to the report.
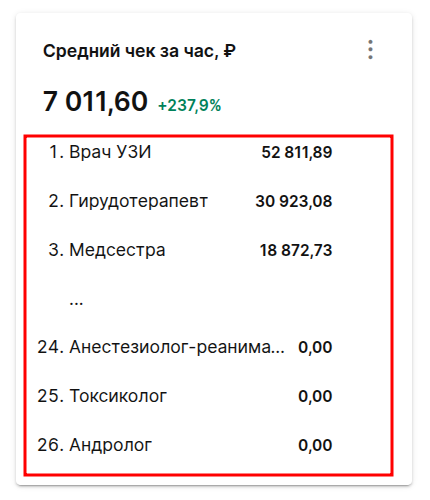
Average receipt per hour
The data in the block is based on the report«Средний чек за час по специальностям».
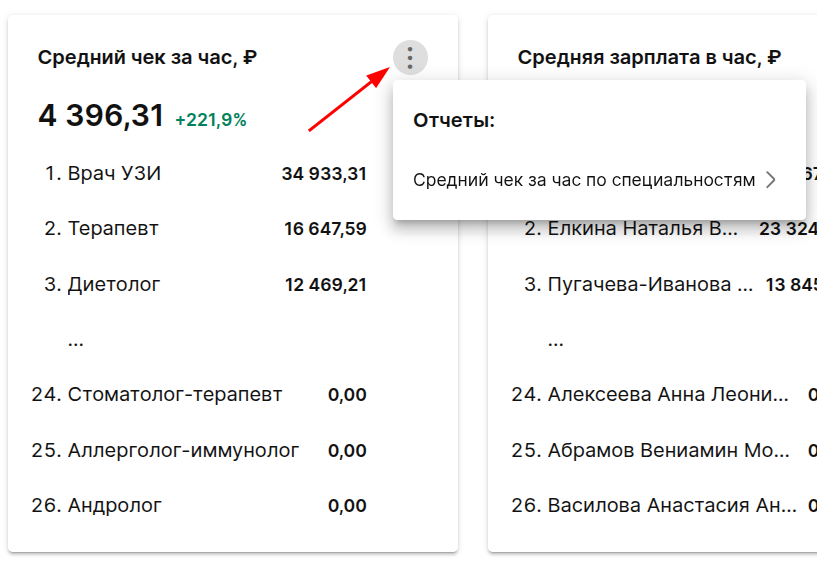
This section shows the total average check per hour for the selected period in your clinic.
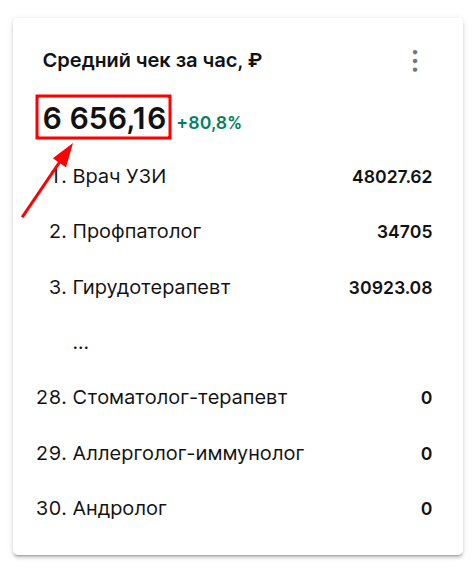
Each row displays:
- Specialization.
- The amount of the average receipt for the services of this specialist.
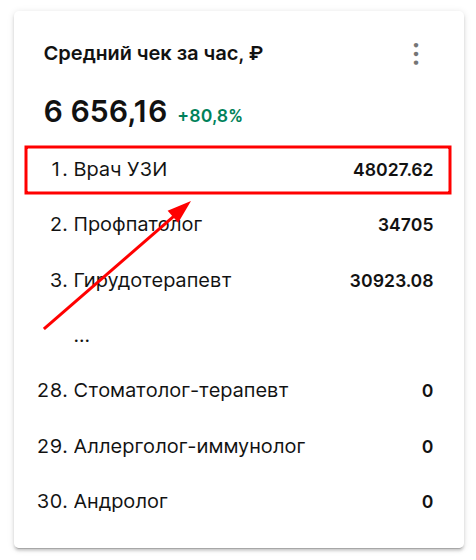
The list shows the first three and last three specialties according to the size of the average check in the clinic. To view all the specialties, go to the report.
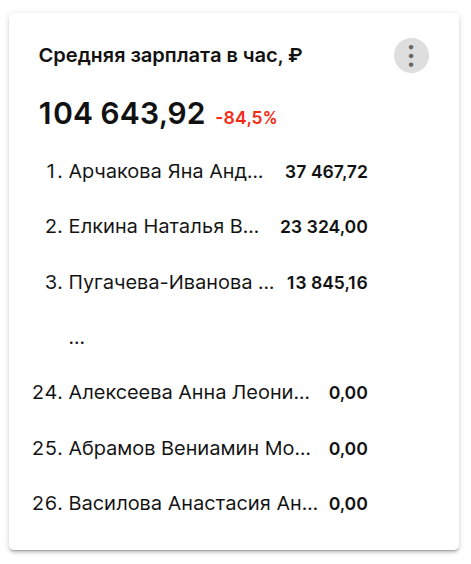
Average salary per hour
The data is based on the report «Сводка по зарплатам»(the average PO per hour column) for the selected period.
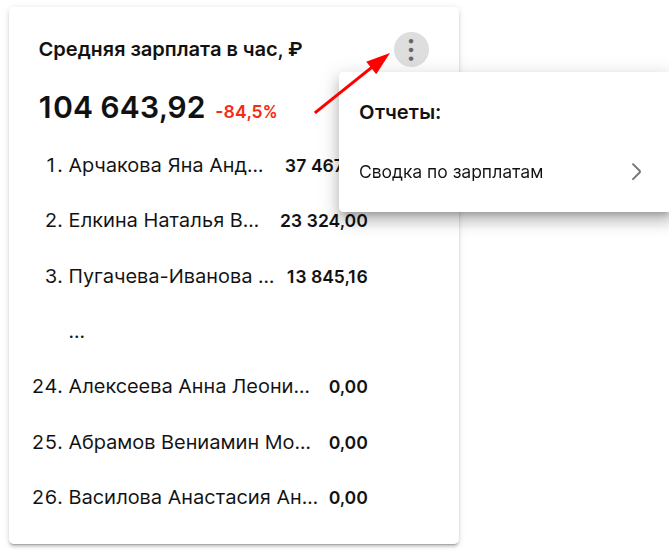
The upper part of the block shows the average salary per hour for the entire clinic.
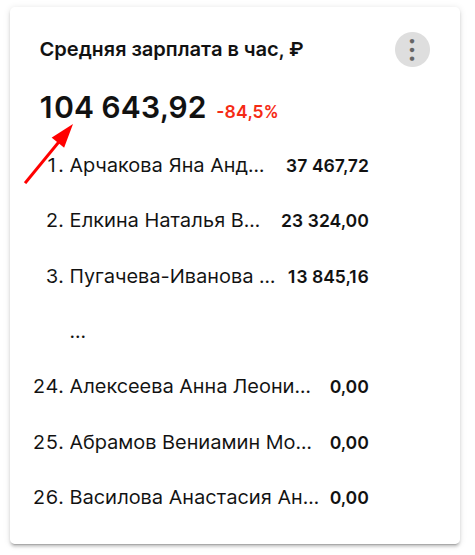
Each row displays:
- Specialization.
- The amount of the average specialist's salary per hour.
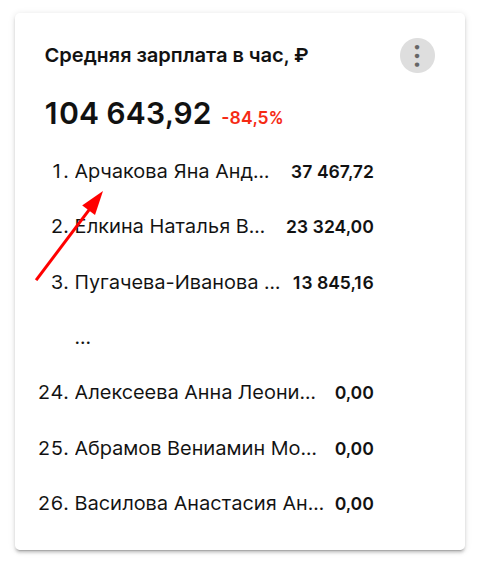
The list shows the first three specialties and the last three in terms of the average salary per hour.